Sara Lee

Sara Lee Corporation Improves its Planning and Forecasting with QlikView

"QlikView has improved our sales and forecasting analysis significantly" said Gary Kahler, Director of Sales & Operations Planning for Sara Lee Household and Body Care - USA. "We now have a powerful yet easy-to-use performance management solution that brings interactive planning and analysis to our employees' desktops. In addition to better analysis capabilities, QlikView saves us more than $35,000 per year in reduced archiving and printing costs alone."

Powered by QlikTech's patented Associative Query Logic (AQL) technology, QlikView's innovative architecture eliminates the costly and time consuming process of designing, developing and maintaining OLAP cubes and, in most cases, also the need to build and maintain separate data warehouses and data marts. This enables companies to develop and deploy fully functional business intelligence and performance management applications in days rather than the customary weeks or months, resulting in greater flexibility, faster ROI, and lower cost of ownership for enterprises. An intuitive, easy-to-use interface makes it possible to spread the power of QlikView through all levels of an organization.

"Sara Lee H&BC is an excellent example of how QlikView can be quickly deployed throughout an organization, providing a wide range of users with better ways to track, manage and optimize their business" said Christer Berg, president and CEO of QlikTech Inc. "We are delighted with the benefits Sara Lee has gained from using QlikView and excited about developing our relationship further"

Colonial Life

Colonial Life & Accident Insurance Company Deploys QlikTech Business Intelligence Software

"QlikView is exactly the tool we have been looking for" said Bryan Allen, assistant vice president of Business MIS Services for Colonial. "We need BI powerful enough to support the sophisticated analytical needs of our business analysts, yet easy and intuitive enough to be used by non-technical independent sales representatives across the country. QlikView is the only reporting and analysis solution we've seen with that sort of flexibility."

Colonial' sales representatives will use QlikView for sales reporting and analysis functions to help them generate higher sales and to identify and close new accounts faster. Colonial's ustomer Service Department is currently using QlikView to analyze its policyholder call center data to enhance Colonial's customer service experience. Colonial anticipates a broad array of future QlikView applications by analysts performing financial and business analysis.

Powered by QlikTech's patented Associative Query Logic (AQL) technology, QlikView's innovative architecture eliminates the costly and time consuming process of designing, developing and maintaining OLAP cubes and, in most cases, also the need to build and maintain separate data warehouses and data marts. This enables companies to develop and deploy fully functional business intelligence and performance management applications in days rather than the customary weeks or months, resulting in greater flexibility, faster ROI, and lower cost of ownership for enterprises. An intuitive, easy-to-use interface makes it possible to spread the power of QlikView through all levels of an organization.

"Corporations are beginning to see the value of business intelligence and analysis beyond its traditional use by power users" said Christer Berg, president and CEO of QlikTech Inc. "The benefits of improved reporting and analysis can stretch throughout any enterprise, no matter how large. Colonial is an excellent example of a company looking to leverage the power of QlikView in new and exciting ways, both for internal power users, managers and executives, and for external, independent agents."

QlikView Training – End Users

Basic QlikView training for normal users. This course is often tailor-made to the client's unique QlikView application(s) and is normally held on site at customer's premises. Covers things like making selections, creation of bookmarks, printing and export. The documentation is based on your applications plus some standard examples.

This course covers all the needs of a QlikView end user.

  • Open QlikView documents
  • Refresh data
  • Introduction of QlikView objects
  • How to navigate through your application
  • List Box
  • Multi Box
  • Charts
  • Current selections (filters)
  • Selecting Data using filters
  • Search for data
  • Locking selections
  • Hierarchies and cycle groups
  • Sort
  • Bookmarks
  • Exporting data to excel
  • Printing of reports
  • Exercises

QlikView Training – Power User

This classroom course is intended for developers and "power users" in QlikView. To follow the course you need little or no prior experience with QlikView. The primary focus of the course is the toolbox of various sheet objects that are used for building the layout/user interface. We will begin by learning the basic functionality in a sample layout and then gradually start modifying and adding to it.

The course is intended as a solid introduction to QlikView, but those who intend to take the Developer, i.e. the general course for developers in QlikView, at a later occasion, may also benefit from it.

When you have finished the course, you should be proficient in the following areas:

  • How to use QlikView for searching information and generating reports.
  • How to design your own QlikView documents, complete with list boxes, tables, charts and any other sheet objects.
  • How to copy layout styles within and between documents.

QlikView Training – Developer

This three-day classroom course is recommended for power users, developers and IT staff that will be developing new or enhancing or maintaining existing QlikView applications. The session covers scripting, data source integration, and advanced GUI development. This module requires a basic working knowledge of databases and SQL.

Schedule

Course times daily: 
9:00am to 5:00pm.

Content daily outline

Day 1

  • QlikView Introduction
  • Versions
  • Installation
  • Project Plan
  • Data Sources
  • Star Schema
  • Smart Structure
  • User Settings
  • Document Settings
  • Script Editor
  • Syntax
  • SQL vs QlikView
  • Preceding Load
  • Connect
  • Linking Tables
  • How to "drive" QlikView
  • Correct interpretation of QlikView
  • Selecting data
  • Clearing selections
  • Search
  • Bookmarks
  • Bookmark Objects
  • Print
  • Export Data
  • Debugger
  • Logfiles
  • Dimensions
  • Create System Tab
  • System Fields
  • Synthetic Keys – how to avoid
  • Loops
  • Autonumber function
  • Loading data from Excel files
  • Loading data from XML files
  • Key Fields

Day 2

  • Mapping loads
  • Cleaning up table structure
  • Listbox Expression
  • Extended listbox functionality
  • QVD Exports
  • Front End best practices
  • Table Box
  • Charts
  • Calendar
  • Transformation of data using QlikView functions
  • Variables
  • Container Objects
  • Fiscal periods
  • Resident loads
  • Where function
  • Different ways of joining tables
  • Inline loading
  • Autogenerate

Day 3

  • Buttons
  • Macros
  • Loading Budgets
  • Cross tables
  • Input fields
  • Security
  • Sorting in charts
  • Selecting in charts
  • Cycle Groups
  • Drop down select in charts
  • Pivot tables
  • Reports
  • Set Analysis
  • Trouble-Shooting
  • Advanced scripting

QlikView Training – Customised

Customised training is offered to meet the needs of customers whose requirements may not fall into one of the 3 other main courses we provide.

This could be refresher training for power users who need an update or even an advanced developer session for those who have been working with QlikView for a while and are ready to learn more complex functionality.

Another example of customised training would be learning to administrate QlikView Server, including installation of all components and understanding and maintaining the QlikView Server in your environment.

The content is really up to you - our customised training service gives you the ability to have covered just what you need to know in a time-efficient way.

NPrinting

NPrinting is the most advanced report generation, distribution and scheduling application for QlikView on the market. It lets you create and modify reports quickly, generate and filter them based on updated data and distribute them to whom and when you need. Get the right information to the right people at the right time.

Rapidly develop and implement scalable reporting solutions. Design reports from QlikView tables, charts and objects using Excel, Word, PowerPoint and HTML with drag-and-drop simplicity.

Schedule reports or let your users generate them on demand from the QlikView desktop application or from a browser. Our intuitive interface will get you up and running in hours. You can develop an Enterprise report scheduling and distribution program in a few days.

NPrinting allows you to send user-appropriate information on an ad-hoc or scheduled basis. You always distribute the appropriate information through the appropriate channel at the appropriate time because users are associated with specific filters, e-mail addresses, directories, Section Access User IDs and passwords. Reports can be delivered by e-mail, saved to user directories or published on your websites. It is also possible to generate reports only if specific data conditions are met. For maximum security, encrypt reports using public key infrastructure.

QlikView and Your Data

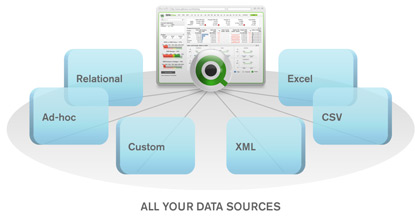
Many organisations deal with the constant battle of data managing their data from many disparate sources and serving it to their users that is simple, and provides a complete picture. QlikView frees you from traditional disk-based BI requirement of long, costly data integration projects. QlikView can access all your data sources: operational applications such as Oracle, SAP®, Salesforce.com; databases such as SQL Server, MySQL, and Oracle underlying custom applications; data in traditional disk-based BI warehouses and cubes; data behind web services; and local data such as spreadsheets.

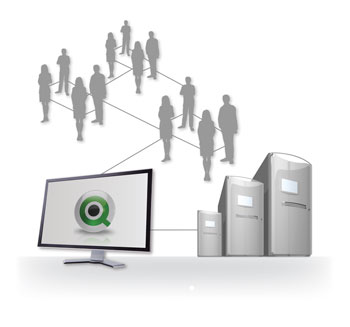
Consolidate Data from many sources

QlikView lets you bring together data from a wide variety of sources. And, because QlikView operates entirely in memory, every source performs lightning fast, regardless of the performance of the under system. QlikView provides:

  • Access to Excel files, flat files and XML documents
  • ODBC and OLEDB access to every relational database
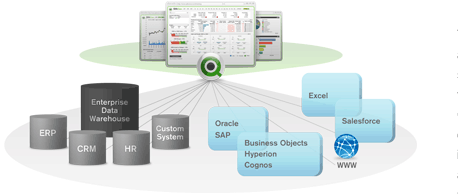
  • Standard interfaces to your ERP system or data warehouse
  • The ability to leverage security definitions to drive application and data entitlements for users
  • The ability to incrementally load data, so refreshes are extremely fast

As new data sources become available, QlikView provides the tools to incorporate them simply and easily—no new cube designs or rebuilding from scratch necessary.

Beyond the Traditional

In traditional disk-based BI tools data must be extracted, transformed, and stored in proprietary data structures such as cubes prior to being accessible to end users. This business intelligence (BI) data integration process is time consuming, difficult, and provides no value to the end user – the only value is to the BI vendor’s consultants, who spend months doing the business intelligence (BI) data integration. QlikView’s in-memory architecture means that data simply needs to be moved into memory. Because memory is so fast QlikView can aggregate and calculate in real-time – the user simply clicks.
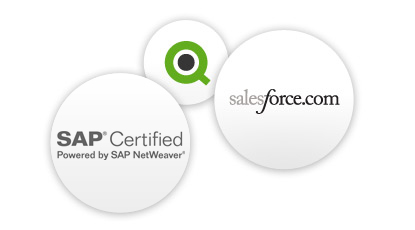
SAP & Salesforce

Too many businesses find themselves hostage to their business applications stack that prevents them from getting to their data in a simple and meaningful way. With purpose-built connectors for some of the most involved applications, such as SAP® and Salesforce.com, QlikView eases access and analysis of your business data. Our customers are able to leverage the business and warehousing assets already in place to provide data to rapid QlikView application development. We’re providing BI at levels and at a pace never before realized by most SAP customers.


Enterprise & IT Friendly

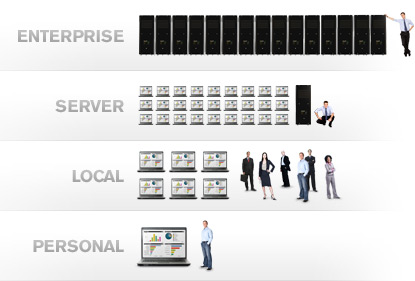
Complete Scalability

QlikView is scalable from one or two users through to supporting tens of thousands of connected users accessing billions of records. Utilizing the most advanced 64-bit Intel multi-core architectures, QlikView provides a unique, resilient architecture that’s automatic load balancing ensure maximum performance even with tens of thousands of users. Along with these features and supporting Seamless integration of 32-bit and 64-bit data sources and the latest in virtualization and cloud deployment models means QlikView has a solution regardless of the size of your organisation.

Easy to Manage
QlikView provides IT with powerful, flexible, and centralized management consoles for measuring, monitoring, and deploying QlikView applications and data. QlikView management consoles give IT a single view into deployment status, whether it’s for a single server or multiple servers spread across geographies, and management of users that can number into the tens of thousands. QlikView offers centralized management capabilities including auditing, load balancing, administration, refresh scheduling, and centralized user management.

Iron-Clad Security
QlikView is designed to protect your organization’s critical data and analysis assets. QlikView’s advanced, easy-to-administer security console enables you to control which users see which analyses, data, metrics, and results. You can also enforce group, role-based, and individual user policies for anything from individual documents to granular row and value restrictions. QlikView also supports standard directory service systems such as Microsoft Active Directory. A configurable directory service provider enables integration with other enterprise directories and user databases.

Maximise Existing Investments
Too many enterprises find themselves hostage to their enterprise applications stack, which prevents them from getting to their data in a simple and meaningful way. With purpose-built connectors for some of the most popular applications, such as SAP® and Salesforce.com, QlikView eases access to, and analysis of, your business data.QlikView is enabling enterprises across the globe to better leverage their investment in existing business systems and data warehouse assets with intuitive access, comprehensive analytics, and sophisticated visualization. The result? Happier, more productive business users. And higher ROI on your entire enterprise stack investment.