Qlik for JD Edwards

QlikView gives JD Edwards users powerful reporting and analysis solutions for World and EnterpriseOne

Whether you run World on an AS400 platform or have a multi-national deployment of EnterpriseOne, chances are reporting and analysis of the data trapped inside your JD Edwards system is a source of frustration.

QlikView can help. QlikView customers get immediate access to their data with powerful, easy-to-use analytical applications. QlikView gives companies:

  • Custom Dashboards and Scorecards—with full drill-down to the transaction level
  • Powerful reporting—combine and distribute data from multiple sources quickly and easily
  • Flexible Solutions—deploy QlikView over the web or via thin clients for remote users
  • Tailored Applications—for the JD Edwards environoment


Unlike most BI packages, QlikView doesn´t rely on OLAP. Instead QlikView gives you all the benefits of OLAP-based BI—multi-dimensional "slice-and-dice" data analysis—without the limitations. QlikView applications deploy quickly, are easy for the IT department to maintain, and give end-users unlimited freedom for ad-hoc queries across any dimensions in the data.

Contact Visual Intelligence today to speak to one of our business consultants about how QlikView can save your company time and money, and help you get the full value that you need from your JD Edwards system.

Qlik for Greentree

….'cost-effective Business Intelligence at your fingertips!'

Businesses thrive on access to and the quality of, their data. QlikView for Greentree will gather and analyse data for the purpose of helping enterprise users adapt and make better business decisions. Effectively the organization is energised and empowered by having a comprehensive knowledge of all of the factors that affect the business.

With QlikView for Greentree you will be provided with an in depth knowledge (KPI’s) about factors such as your customers, competitors, suppliers, economic environment, and internal operations. Business Intelligence of this calibre drives performance and provides a source for competitive advantage.

Key Benefits

  • Responsive Custom Dashboards & Scorecards
  • Integrated Deployment Options
  • Flexible Tailored Applications
  • Powerful Reporting

    Responsive: 
    Greentree customers are able to deploy QlikView quickly and easily. Getting running in days not weeks means you not only get early benefits from empowering information but you also save money on consulting/training fees and precious time.

    Integrated: 
    QlikView for Greentree combines and collates data from Greentree and other internal or external systems—seamlessly. This advanced level of integration means your analysis and reporting is completely accurate, focused and altogether meaningful.

    Flexible: 
    There’s no, “how do we make it fit?” or “do we need to reengineer? QlikView for Greentree is configured and scales to your individual business needs. The result is answers to questions and solutions to challenges, not more problems.

    Custom Dashboards & Scorecards: 
    Dashboards and scorecards can be fully customised, with full drill-down to the transaction level.

    Powerful Reporting: 
    The powerful reporting features allow you to combine and distribute data from multiple sources quickly and easily. Deployment

    Options: 
    The deployment options enable you to deploy QlikView for Greentree over the web or via thin clients for remote users.

    Tailored Applications: 
    Applications have been tailored especially for your Greentree environment.

    What QlikView for Greentree means for YOU...

    As business professionals you know that customers are your most important asset, but also that profits are gained and lost in business details. QlikView for Greentree allows you to understand both. Effectively the whole organisation is enabled!

Qlik for BPCS

QlikView for BPCS will provide powerful, rapidly deployable business analytics applications pre-configured and optimized for your BPCS environment.

Powered by QlikTech’s patented AQL™ analytics engine, QlikView for BPCS provides all categories of users – executive, power and occasional – with interactive and highly intuitive business performance management and analysis capabilities. QlikView can be deployed in a matter of days instead of the weeks or often months required for traditional BI and OLAP solutions. The result is a powerful BI solution that can be deployed quickly across your organization, delivering a rapid ROI and a low cost of ownership.

Powerful Business Analytics Capabilities 
QlikView for BPCS provides powerful business analytics and performance management capabilities that enable you to better track, analyze and manage your business. Key QlikView for BPCS features include:

  • Rapid, easy access to AS400, UNIX-based BPCS data
  • Combines data from BPCS and any DBC/OLE DB enabled sources in the same applications
  • Powerful, intuitive interface makes end-user training rapid and effective
  • Full drill-down into charts, graphs, pivot tables, and list boxes


Rapid Deployment and Return on Investment 
BPCS customers who need business intelligence can avoid the costly, time-consuming process of building data warehouses and OLAP cubes by using QlikView. Applications are developed and deployed in days rather than weeks or months. Compared with other business intelligence solutions. QlikView delivers greater flexibility, faster ROI, and a lower total cost of ownership.

“With the old system, I had to spend five days a month to collect, combine, refresh, and distribute data. Today, one day a month is enough. QlikView has freed up almost 50 days a year for me that I can spend on more value-added activities.”

Martin Radichs, Technical Support Specialist, Remy Amerique

Qlik for SalesLogix

iReports for SalesLogix is a fully integrated sales and marketing analysis module for your SalesLogix CRM system. Based on QlikTech’s QlikView business intelligence platform, iReports gives SalesLogix users a real-time snapshot of organizational, departmental and individual performance against objectives.

Analytics Dashboard

The iReports Analytics Dashboard Viewer lets users monitor relevant key performance indicators (KPIs) quickly and easily. Dashboards provide quick, one-stop shopping for business-critical understanding and can be tailored to ensure only the most useful content is viewed. iReports’ drill down capabilities lets users to move quickly from the Dashboard view into the transaction details.

Benefits include:

  • Seamless integration of SalesLogix data with external content—including back-office transactional data, reports, web content and external databases
  • Applies flexible business rules and alerts to monitor changes and trends in your business
  • Instant Sales analysis of sales pipeline, forecasts and close rates 360 Degree view of marketing programs—analyze campaign response rates, sales success, conversion rates and marketing program impacts
  • Rapid deployment—most implementations take just one week

Dakotacare

QlikView Offers Dakotacare a Cure for Information Overload

Dakotacare, South Dakota’s only statewide health maintenance organization (HMO), has dramatically improved customer service, streamlined communication with care providers, improved claims processing, and enhanced self-auditing capabilities. The key to these improvements is QlikView, an innovative business analysis tool from QlikTech, the world’s fastest-growing business intelligence software company.

In comparing QlikView against “traditional” OLAP-based Business Intelligence solutions, Mark Tracy, director of information technology at Dakotacare, found QlikView to be the most cost-effective solution, the easiest to deploy and fastest to learn. “My biggest hurdle in selecting QlikView was skepticism based on the price point; I couldn’t believe it would do what it said, at the price that it was,” he said. The free download from the QlikTech Web site convinced Tracy, and he in turn, convinced Dakotacare’s management team.

Dakotacare relies on several enterprise databases and ERP systems to manage information from care providers, suppliers, clinics, hospitals and patients. The HMO’s legacy databases were challenging to manage and individuals within the Dakotacare organization found it difficult to access the information they needed to do their jobs efficiently. A year ago Tracy implemented QlikView on a dual-core X64 Xeon-based server, giving the HMO new abilities to aggregate, analyze and audit data. QlikView not only provides real-time access for the organization, but allows its employees to instantly put information in the hands of its constituencies as well. DAKOTACARE employees now have the information they need at their fingertips.

“QlikView opened up new opportunities for us. Its phenomenal response time means that we can investigate time-sensitive issues accurately and quickly. In our case, instant access to data means sorting through hundreds of millions of records daily. QlikView’s 64-bit multi-processor platform design has enables us to significantly improve our accuracy, efficiency, and overall productivity,” said Tracy. “At the end of the day, Dakotacare is about making life easier for our members, clients and health care providers, and QlikView has enabled us to meet this challenge.”

Health insurance companies process massive amounts of data. Dakotacare’s claims data set alone contains more than 140 million records with hundreds of columns of data. This data set contains every detail on every claim paid since 2001. Because of this quantity of data, inaccuracies and discrepancies in data entry were difficult to find and manage. Using QlikView, Dakotacare quickly uncovered and corrected many of these errors, which impacted claims processing, provider reimbursements and ultimately, the bottom line. QlikView allows Dakotacare to “get it right the first time, before we get checks out the door,” said Tracy.

“Health insurance companies have unique operating demands that require business analysis tools that can probe large volumes of data quickly and easily and help them solve real business problems,” said Rick Pitts, CEO of QlikTech U.S. ”In an increasingly on-demand marketplace, leading HMOs like Dakotacare are using QlikView to leverage vital data across its organization and respond quickly to its constituents’ needs.”

QlikTech is leading a new class of easy-to-use, fast and flexible business analysis solutions that empower individuals to improve corporate performance and drive innovation. QlikTech’s flagship product, QlikView 7.2, extends the company’s vision of simplifying business analysis, offering solutions that can be deployed in days, where users can be trained in minutes, and where end users have the freedom to be more creative in their analyses.

About Dakotacare
Formed in 1985, Dakotacare is South Dakota’s largest and only statewide health maintenance organization, serving over 110,000 members. In addition to South Dakota, Dakotacare and its subsidiaries’ service areas include: Illinois, Iowa, Kansas, Minnesota, Nebraska, North Dakota, Tennessee, Wisconsin and Wyoming. Dakotacare has 130 employees in Sioux Falls and at its Webster, SD claims processing center.

Channellock

Channellock, Inc., the leader in the design and manufacture of high-quality pliers and hand tools, has implemented QlikView to help improve data transparency across the company. With QlikView on a 64-bit HP Proliant server, the Channellock sales teams have access to timely business information that helps them build and close sales and unearth trends faster and more effectively than the competition.

“Channellock’s commitment to American craftsmanship and quality is key to everything we do,” said Mark Yoder, National Sales Manager at Channellock. “In QlikView, we have found a tool that gives each of us instant access to all the data throughout our enterprise, and lets us manipulate that data anyway we need to. For the sales team, this means we can anticipate customer needs, find unanticipated insights and respond to them faster than the competition. In the end, using QlikView means that nobody has to waste valuable time fumbling through irrelevant data or waiting for reports from the IS staff.”

Channellock is the worldwide leader in manufacturing premium-quality pliers. With more than 4,000 wholesale and retail customers in the United States and in 45 countries around the globe, the Channellock sales team has a lot of ground to cover. Information on new products, sales, promotional details and customer requests amount to a tremendous volume of data that has not always been easy to access. Prior to implementing QlikView, the team relied on a JDE system running on the iSeries (AS/400) platform with green screen interfaces. Implementing QlikView on top of the AS/400 platform enables the sales team to access and analyze all of this data simply through a Web browser, empowering them to respond faster and more effectively to customer needs.

Since Channellock operates with a small management team, the need for each employee to have immediate access to relevant data is vital to the way the company conducts its business. QlikView has enabled all salespeople, especially the management, to analyze data in new ways. As a result, the company has gained hidden insights into their data, resulting in the ability to identify trends quickly and test the validity of some of those insights.

“Channellock is a true leader in quality and performance in the manufacturing sector. At the heart of the company’s long history is a combination of innovation and dedication to excellence. The company has developed a global network of manufacturing and sales teams, making it one of the most advanced operations in its industry,” said Rick Pitts, CEO of QlikTech U.S. “By providing a means for the company to access and analyze business data on the fly, QlikTech is helping Channellock ensure its current and future success.”

QlikTech is leading a new class of easy-to-use, fast and flexible business analysis solutions that empower individuals to improve corporate performance and drive innovation. QlikTech’s flagship product, QlikView 7.2, extends the company’s vision of simplifying business analysis, offering solutions that can be deployed in days, where users can be trained in minutes, and where end users have the freedom to be more creative in their analyses.

About Channellock
Founded in 1886, Channellock, Inc. is a worldwide leader in the manufacture of high-quality pliers and assorted hand tools. For more information on Channellock products, sales contacts, breaking news, and historical information, visit the Channellock Interactive website at www.channellock.com.

WD-40

After deploying QlikView, WD-40 immediately experienced increased productivity and gained access to invaluable company information that previously was inaccessible.

Through the use of QlikView, WD-40 has replaced weekly hard copy ERP reports and eased demands of the IT department. Prior to deploying QlikView, WD-40 calculated customer sales totals manually at the end of each year by totaling up historical hard copy reports; now annual sales totals are available immediately with a single click. WD-40 employees can simply open up QlikView, make their data selections and analyze the information they need – from their desktops or from a Web server. As a result of this success, the company is planning to expand QlikView into other areas of its business.

"We have found ourselves in the position where we can now analyze over 500,000 order lines in seconds and in real time,” explains Julian Spencer, finance and operations director, Europe for WD-40. “On the sales side we use QlikView to find selling opportunities with existing customers as well as to highlight customers who are ordering less frequently than before. On the control side, we can track margins and customers' rebates instantly whereas before it took hours of manual data collation. QlikView is a great way to get at company data quickly and easily."

QlikView has also enabled the company to investigate profit margins in greater detail by drilling down to product information and highlighting customers who have not placed recent orders. The finance and logistics departments are now able to look at orders, margins and stock in a way that was not possible before.

“Implementing QlikView couldn’t have been easier,” said Jonathan McCoy, IT manager for WD-40. “It took less than two weeks to create our sales analysis application and it’s as easy to use as Excel, requiring no training whatsoever. The system consistently gives us new ideas on how we can make maximum use of its capabilities. When users want a new report or additional data, they know it’s going to be possible. When you’re running an IT department, it’s great to know that you will be able to give users what they want with a minimum amount of effort.”

QlikTech is leading a new class of easy-to-use, fast and flexible business analysis solutions that empower individuals to improve corporate performance and drive innovation. QlikTech’s flagship product, QlikView 7.2, extends the company’s vision of simplifying business analysis, offering solutions that can be deployed in days, where users can be trained in minutes, and where end users have the freedom to be more creative in their analyses.

“WD-40 is yet another leading international brand realizing the power of QlikView’s simple design,” concludes Andy Honess, managing director of QlikTech UK. “In today’s on-demand economy, people require immediate access to, and the ability to analyze data. By providing precisely the right level the information, when it’s needed, QlikView is helping users improve their own performance, as well as that of the company.”

About WD-40
WD-40 Company is a global consumer products organization, renowned for its range of popular household brands, which are found under the sink, in the garage and in the toolboxes of homes throughout the world.

Its products are now sold in more than 160 countries worldwide. WD-40 Company's corporate headquarters and Corporate Brand Support Centre is based in San Diego, California, U.S.A. The brand is supported by a group of international offices.

The company recorded sales of $242.5 million in 2004. WD-40 has grown to more than 254 employees worldwide, employing 42 at its UK headquarters in Milton Keynes.

About QlikTech
QlikTech is the world’s fastest growing business intelligence software company. QlikTech believes information should be available broadly, affordably, and quickly. QlikTech’s flagship product, QlikView, makes sophisticated analysis dramatically easier to deploy, use and maintain. QlikTech’s patented technology allows instant, in memory, manipulation of massive datasets on low cost hardware, allowing affordable widespread deployment of highly sophisticated analytic applications in days. QlikView’s click-driven, visually-interactive interface is simple for end users to learn and use. QlikView has more than 3,384 customers in 58 countries, and adds 6.9 new customers each working day. In addition to hundreds of small and midsized companies, QlikTech’s customers include large corporations such as AstraZeneca, Pfizer, Top Flite, 3M, and The Campbell Soup Company. QlikTech is privately held and venture backed by Accel Partners, Jerusalem Venture Partners, and Industrifonden. Founded in Sweden, QlikTech has subsidiaries in the United States, United Kingdom, Germany, Netherlands, and Scandinavia, and over 100 partners across the world.

Helsingborg Hospital

QlikView increases the quality of Helsingborg Hospital

Helsingborg Hospital is one of Sweden's largest emergency hospitals that is converted into a subsidiary company, and has 2400 employees. The activity has a common vision that indicates its ambition and distinguishes the activity; high-qualitative and personal care in a nice environment without waiting times, care, diagnostics and therapy in the front line development, working methods and processes that are evaluated and improved continuously and proud, competent co-workers. Medical care is a dynamic activity that is constantly changing. For that reason there is always a re-creation and reconsideration in progress within the hospitals walls.

Make use of important information

Within Helsingborg Hospital there are a large number of data systems that are handling different areas. The systems are among other things handling patients, waiting times, economy, journals and diagnoses. The quality of producing statistics and analyzing information from these systems has been very low. Now the decision is taken that this has to change. There is so much information in the different systems that have to be coordinated for making use of it in the best way. Different opportunities for this have been investigated, and finally it was decided that QlikView would be used. The work of implementing QlikView in the organization is now going on, and in the future it is expected that about half of the 2500 employees will be using QlikView. This is why it is decided to invest in QlikWeb, which gives all users the possibility to look at the same information at the same time.

"QlikView is our washing machine!"

QlikView is superb, Margareta Davegaard says spontaneously. It is incredibly simple to analyze data in QlikView. The program has really become our washing machine that is cleaning up among all the information in all our different systems within Helsingborg Hospital.

Margareta Davegaard 
PR Manager at Helsingborg Hospital

A change already at the input process

The four most important systems that will be integrated by QlikView are handling staff, patients, economy and journal systems. Margareta Davegaard is PR Manager and very much in favor of QlikView and what it will accomplish for Helsingborg Hospital. It's not only the quality of the information management that will be increased, but also the quality of the input itself. By QlikView also the staff taking care of all input will get an overall view of the value of the information they input, Margareta Davegaard says. She is also one of the key figures in the work with the information management at Helsingborg Hospital.

FiberMark

FiberMark uses QlikView to pull together data from Oracle, J.D. Edwards, SAP, Access, and Excel into individual applications - saving the company time and money.

Company Background

FiberMark is a multi-national company headquartered in Vermont, producing specialty fiber based materials. Like many other firms, Fibermark was facing a common problem. Their ERP system was doing a great job of creating and managing hundreds of transactions a day, but Fibermark's management team was forced to run thousands of pages of reports to try to glean any information or insight from that data. Fibermark also had mission critical data in a wide range of other enterprise systems and databases, including Oracle, SAP, Excel and Access. The quantity and distribution of the data made it especially difficult to analyze what was happening in the business and how to react.

Fibermark initiated a search for business intelligence tools and evaluated several, eventually choosing QlikView 5 due to its intuitive nature and ability to gather and analyze data from a wide range of sources.

Implementation

Fibermark initially selected QlikView to improve insight into sales data and to distribute information and analysis tools to the sales force. Within one week, the initial sales analysis applications based on QlikView 5 were deployed to the sales force.

"I've been working with ERP systems for years", said Joel Taylor, director of IS for FiberMark. "And I'd come to the conclusion that they were nothing but glorified report writers. Within 15 minutes of seeing QlikView I realized what it could do and why we needed it. It's quickly become the most useful software tool we have."

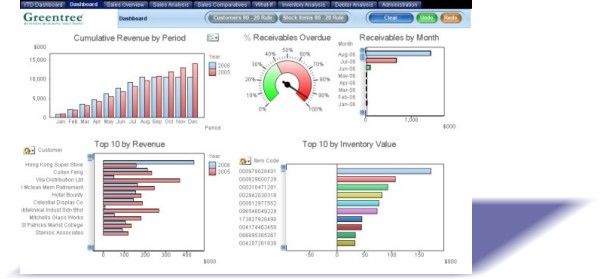
Fibermark distributes sales analysis to sales managers and to the remote sales force over the Internet through QlikView Web server. There are 130 users, including five power users. The sales force uses QlikView and the sales analysis application to evaluate progress against goals, compare sales statistics against baselines, and identify trends and problem areas.

Once the application was deployed, senior management from other business functions saw the insight and power that QlikView was able to deliver, and requested QlikView applications for their departments. Eventually, QlikView was deployed for sales analysis, purchasing analysis, inventory control, financial analysis, and human resources. The QlikView applications pull data from a wide range of sources. "It doesn't matter where the data is, as long as there is an ODBC driver, we can get to it", said Taylor.

Insights and Savings for Fibermark

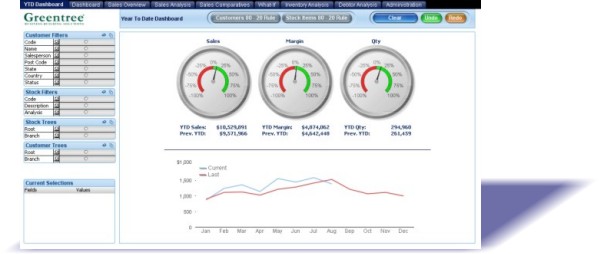
QlikView offered Fibermark some unique capabilities, including the patented AQL associative database that resides in a computer's memory, rather than a data warehouse or OLAP cube. This means that all analysis is done locally when requested and removes the need to develop complex, expensive data structures. Since the data is not "pre-aggregated", it is possible to interact with the data from any level, any dimension with complete drill-down capabilities.

Additionally, there is insight in what is not selected, through the "reverse answer concept". When a field is selected in QlikView, all the values associated with that field fl oat to the top of their column; alternatively values not associated are grayed and sink to the bottom of the display box. "Reverse answers tell me more than anything else" said Taylor. "Now I not only know who is selling a product; but who isn't selling it. When I know that, I can try to find out why. That solves problems we might not have known we had."

But it was more than QlikView's ease-of-use and intuitive user interface that really convinced FiberMark of its value. "QlikView paid for itself instantly just in error corrections" said Taylor. "We discovered problems with the way some orders were being filed; finding and fixing them easily saved us the cost of QlikView. And if we hadn't gotten our money's worth then, we saved as much money over nine months in savings from paper and print cartridges. With QlikView our people don't have to run endless reports all the time. We cut our printing costs in half just by installing QlikView."

A Product People Use and Enjoy

Every enterprise dreads the idea of "shelf ware", the expensive system that is so difficult to learn and hard to use that ends up gathering dust on the shelf. QlikView lets users interact with their data in a natural and intuitive manner. End user training can be completed in a few hours as opposed to days. When software is easy to understand it is adopted much more widely throughout an enterprise, and becomes a useful tool and provides real ROI. FiberMark doesn't worry about shelf ware with QlikView. QlikView has provided Fibermark with access to their data, real and immediate ROI, and a software solution that has been enthusiastically embraced throughout their company. This all comes together and helps deliver tangible competitive advantages for FiberMark short term as well as for a long time to come.

Scania Danmark

Scania Danmark A/S gets things done quicker and easier thanks to QlikView

Challenge

With a market share of approx. 30% and 31 service stations spread out all over Denmark, Scania needed to be able to view information anywhere, and in real-time.

Solution

All desired data can be extracted in a structured way from the AS/400-server. Scania Danmark A/S uses QlikView to analyze several business areas including sales and fi nance. For example the sales people receive instant feedback about what has been reported to head office.

Benefits 
· Simplified review, reporting and follow-up in real-time for management 
· Extended life of existing systems 
· Instant information access and reporting for sales people 
· Stock and delivery information available in real-time

Like many large companies, Scania Danmark A/S had an organization that was widely spread and was using a number of different applications on different platforms, including generic reporting systems. It was important to Scania to quickly retrieve and compile all necessary information, and train its organization to use this information proactively. What was needed was an analysis tool that could be implemented very quickly and that didn't require a lengthy specification process for each new application. After evaluating a number of rival products they saw the advantages of using QlikView, which was easier to use, cheaper and far more fl exible than its competitors.

Many units need information

Scania is a world leader in the sales and service of heavy trucks and buses. Its market share in Denmark is about 30%. That means there are over 16,000 vehicles that need servicing at regular intervals at the 31 service stations dotted around the country. By implementing QlikView, all service stations have instant access to all the information they need. This is achieved by adding a QlikView Server, a client/server solution for analyzing QlikView documents in an ordinary web browser.

Scania gains many advantages from the new system. The exact data required can be extracted from AS/400 in a structured way. Fields can now be named in plain English when loading data. QlikView also highlights incorrect data in the database. Errors such as incorrectly registered vehicles, or vehicles registered more than once are seen instantly.

Several areas analyzed

By implementing QlikView we have greatly enhanced and extended the life of our existing systems as well as simplified the management reporting.

Björn Jacobsen, Financial director, Scania Danmark A/S

Scania Danmark A/S uses QlikView for analyzing several business areas, including sales and fi nance. The sales people get instant access and feedback on what has been reported to head offi ce. Information such as delivery times for ordered trucks, the number of vehicles available for immediate delivery, etc are all available in real-time. An application has also been developed to allow management to follow up and review the business. The application also gives direct access to the latest version of documents from different departments such as training schedules, spare parts, orders etc.

Even the people on the shop floor will benefit from using QlikView

Modern trucks are technically complex and produce a large amount of data. Data about speed, fuel consumption, wear, distance, etc, is stored in the truck's computer. All this information can be analyzed in QlikView.

Björn Jacobsen, Financial director, Scania Danmark A/S

The next step

The next step is to make QlikView available to the entire Danish Scania organization. The QlikView Server will then be used throughout the organization, where more than 1,100 employees will be able to make use of QlikView. Once in place dealers will be able to analyze business on the fly, and display information instantly to their customers. Customers will be able to get an on-thespot delivery date - a real advantage in logistics planning for everyone concerned.