Free Qlik Sense on-line Training
Latest Qlik Sense Videos
Distributing QlikView Documents
Welcome to QlikView in the Enterprise
QlikView Natural Analytics™ Experience
Overview of the QlikView Platform
Monitoring a QlikView Deployment
Setting up a Center of Excellence for a QlikView Deployment
What's New in QlikView Ajax Client
What's New in QlikView Desktop
What's New in QlikView Server & Publisher
General. Visual Intelligence Ltd hereby authorizes you to view, print, copy and distribute information published by Visual Intelligence Ltd on this site provided that (a) the information may be used internally (by you or any third party to whom you distribute it) only for informational, non-commercial purposes; (b) no fee may be charged for distribution of any information to any third party; and (c) any and all copyright or other proprietary notices that appear herein, together with this Legal Notice, must appear on all copies that you make or distribute.
Disclaimers. Any product, process or technology published on this site may be the subject of Intellectual Property rights reserved by Visual Intelligence Ltd and/or its licensors, and are not licensed hereunder. Any software programs and any corrections, updates or new versions of any software programs that may be made available by Visual Intelligence Ltd through this site are provided subject to the additional terms, conditions and restrictions. If no additional terms are provided, any software programs or software code is governed by this provision.
All information provided via this site, including, without limitation, any Visual Intelligence Ltd product or service plans, software programs, software code, offerings, or programs, statements of future directions, "white papers" or other technical or marketing materials (collectively, "Information") is intended for informational purposes only and is subject to change or withdrawal by Visual Intelligence Ltd at any time without notice. Visual Intelligence Ltd assumes no responsibility for the accuracy or completeness of the Information. THE INFORMATION IS PROVIDED "AS IS", WITHOUT WARRANTY OF ANY KIND, INCLUDING WITHOUT LIMITATION ANY IMPLIED WARRANTIES OF MERCHANTABILITY, FITNESS FOR A PARTICULAR PURPOSE OR NON-INFRINGEMENT. Visual Intelligence Ltd FURTHER DISCLAIMS ANY LIABILITY IN CONNECTION WITH THE SITE OR THE INFORMATION PROVIDED HEREIN. Some jurisdictions do not allow the exclusion of implied warranties, so the above exclusion may not apply to you.
Limitation of Liability. IN NO EVENT WILL Visual Intelligence Ltd BE LIABLE TO ANY PARTY FOR ANY DIRECT, INDIRECT, SPECIAL OR OTHER CONSEQUENTIAL DAMAGES FOR ANY USE OF THE SITE, THE INFORMATION, OR ANY OTHER HYPERLINKED WEBSITE, INCLUDING, WITHOUT LIMITATION, ANY LOST PROFITS, BUSINESS INTERRUPTION, LOSS OF PROGRAMS OR OTHER DATA ON YOUR INFORMATION HANDLING SYSTEM OR OTHERWISE, EVEN IF Visual Intelligence Ltd IS EXPRESSLY ADVISED OF THE POSSIBILITY OF SUCH DAMAGES.
The site may contain hyperlinks to other Web sites controlled by parties other than Visual Intelligence Ltd. Visual Intelligence Ltd is not responsible for and does not endorse the contents or use of these Web sites.
Visual Intelligence Ltd reserves the right to modify or update this statement at any time without notice.
Last updated: 29 June 2009
Customers are your most important asset. But how much do you actually know about them?
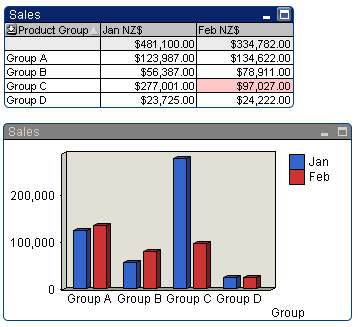
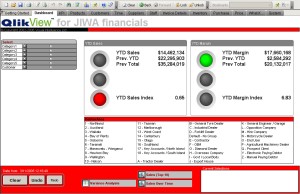
Your ability to track, analyze, and understand all aspects of your sales ?
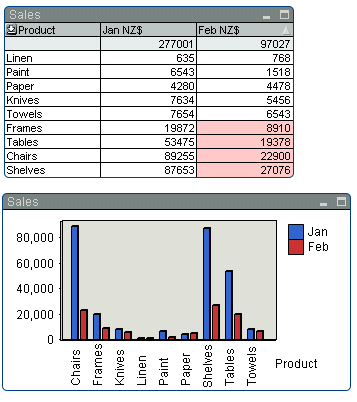
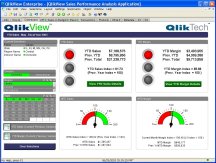
What is being sold to which customer, when and by whom ?
It is critical to identify profitable customers, low performing sales reps, and sluggish products.
With QlikView Sales Performance Analytics, you have complete visibility to business-critical customer, sales, product, budget, and channel data in a single, powerful yet easy-to-use business performance management application. QlikView Sales Performance Analytics also allows regional sales managers and sales reps to track their performance against goals and identify regional opportunities based on their customers? behavior.
QlikView Sales Performance Analytics can easily be integrated with your enterprise systems, even for companies running different ERP and CRM systems in different divisions. QlikView provides a rapid ROI due to its rapid deployment and ease-of-use.
• CEOs/CFOs want the big picture. Dashboard presentations of KPIs tells the story quickly
• Business Analysts want to see everything. QlikView starts with transaction-level data and builds up, allowing sophisticated, complete analysis without pre-aggregation or imposed dimensional limits
• Sales Managers/Reps want quick access to their account information. Find out in seconds what my customers are buying and not buying. Extensive insight to make your sales calls more effective
• IT Managers want applications that are easy to maintain. By serving all of the above end-users with a single master file, the maintenance burden is lifted from the IT department
The QlikView Sales Performance Analysis Application gives customers the full range of analysis, from the dashboard to the individual transaction.
• Complete Dashboard view - customized to your required KPIs
• Sales vs Budget analysis
• Detailed drill-down into sales trends by product line, region, channel, sales rep and more - combine your analysis across more than 60 dimensions
• Customer Profitability Analysis
• Transactional monitoring including Open Orders by product, customer, region, or channel for any time period
• Trends, Decile Analysis, and What-if Scenario Analysis for building projections
With our Sales Performance Analysis application, companies can focus on profitability. Who are their most profitable customers? Which sales reps are ahead of budget, and what are they selling? Which product lines contribute the most margin? How will raising the price of a given product by 4% impact profitability?
A traditional report is static. The information will always be presented in the same way each time you print the report. It will often give you either too little information or too much information. And once you have your report and check the figures new questions come up that the report you just printed can not answer.
Traditional Report Example:
Product Group | Jan NZ$ | Feb NZ$ |
Group A | $123,987.00 | $134,622.00 |
Group B | $56,387.00 | $78,911.00 |
Group C | $277,001.00 | $97,027.00 |
Group D | $23,725.00 | $24,222.00 |
In the example above we see that Product Group C has dropped from $277,001.00 to $97,027.00. But we can not see which products within the group that have dropped most. We have no information on the individual products, customers or Sales Reps connected to Product Group C. In this case we must print several more reports to find the reason why sales have dropped so much for Product Group C.
QlikView is Interactive:
Here we see a screenshot of how the same figures can be presented in QlikView. The beauty is that we can dig into the findings interactively.
By clicking on Product Group C we immediately see the figures on product level.
To make informed, high impact decisions, organisations need quick access to critical information and data across their whole line. The range of different systems used within companies makes the information hard to find. Customer information may be stored in one database, accounting and sales information in another and information about competitors may be found on the web.
Data collection
|
Most companies have a lot of data. Often this data is stored in different databases and even on different servers in different locations. |
A business intelligence tool like QlikView will let you gather and analyse data from any source.
Tired of Reports, Reports, Reports....
Often management is drowning in reports. Everyone wants to produce as good a report as possible resulting in endless time being spent trying to persuade the reader that their department is the most important within the business. QlikView and QlikWeb reduces the need for reports to a minimum.
An ordinary database or ERP system (Enterprise Resource Planning) gives you the opportunity to print a wide variety of different reports. These reports are predefined lists of data, hopefully sorted the way you want it. The problem is that they do not give you more than a static list of some assorted data. If you want any other information you have to print another report and then try to analyse the information manually or using Excel or some other tool.
With QlikView you will be able to analyse any subset of data and any type of relation within that data just by clicking on the item you want to analyse. Four "clicks" in QlikView often equals between 4-16 hours of work using ordinary reporting.
Raising profits
What means are there to raise the enterprise profits?
• Cutting costs
• Increasing productivity
• Targeting the right customers
• Finding the right products
• Finding the right suppliers
How do you know which costs to cut? What is the difference between the profitable sales team and the team with poor performance? Who is the best supplier if you compare both price, delivery and quality?
Graphically presenting information visualises the information
With a good Business Intelligence Application you will get answers to all these questions. You will truly get to know the essence of you business
Saving time Managers across the organisation normally spend days preparing all sorts of reports and top management is drowned in reports. Most reports do not get read. The amount of time/money spent on this is enormous.
• Weekly reports
• Monthly reports
• Project reports
• etc...
A good business intelligence tool will virtually diminish the time spent to prepare reports throughout the whole enterprise. Top management will have the same insight as middle management, thus eliminating the need for time consuming data gathering. Lower management reporting can instead include more of improvement proposals and concentrate on trying t o come up with means to rectify and explain any findings.
The choices available to companies looking to add business intelligence, reporting and analysis to their operations can be overwhelming. There are literally hundreds of product offerings to choose from: a Google search for “business intelligence software” will yield more than 24 million responses – and perhaps more critically – more than 50separate vendors using adwords tagged to just that phrase! Further, most of the products in the Business Intelligence are technically similar. Throw in technical jargon and marketing speak and making relevant differentiations becomes quite difficult.
To cut through the clutter and streamline their decision-making process, most companies build a short list of preferred vendors based on some set of criteria, and then invite those short-listed companies to compete for their business. Often this involves an elaborate RFI process, with extensive spreadsheet-based checklists where different products are compared across potentially hundreds of attributes and factors. These processes tend to favour larger vendors – those with product scope necessary to achieve a check in the “yes” box for the most features. This type of process also tends to favour complex products – as those products are most likely to have the most features. Needless to say, a long list of checked boxes contributes little toward understanding the benefits and complications created by using a particular product. The typical RFI process often produces an extremely homogenous short list – “winners” that all clump together with look-alike features and attributes.
So how to choose? Companies can both simplify and greatly improve the quality of their short-list selection process by taking a different approach – rather than creating a master list of all possible features and then checking off feature after feature in an attempt to “keep score,” companies should focus on the business value and ongoing expenses that different solutions create – measured across a few key variables. This article is intended to outline key criteria that companies should consider when creating their shortlists – and making their ultimate selections.
Just as product marketers talk about delivering the “whole product” rather than just a piece of the overall technology, companies should look at the time required to implement a complete working solution – one that makes it possible for business users to answer business questions. There are two measures to watch here: Time till the first application is deployed to an end-user, and total deployment time for the entire project.
According to a recent survey of DM Review readers, only 5% of companies were able to deploy a usable, working analytics application within 1 month – and the average time to first application deployment was 5 months. More than a quarter of the companies surveyed took more than 6 months to deploy a single working application, and the average time to completion for projects was 17 months – just shy of 1 ½ years.
Many of the BI solutions available today are “infrastructure heavy” with extensive pre-application deployment work paving the way to the actual end-user products. Companies should be aware of the timelines that their BI vendors require when they make their selections, and how those timelines match up with their expectations and requirements for the project. During vendor evaluation, companies should be sure to include at least one vendor with a track record of delivering rapid deployments (1 months or less start to finish) so that they can weigh the benefits and tradeoffs in their evaluation process.
Key Metrics:
There’s an old saw about ERP software: “It’s just like cement – you can pour it to look like anything you want, but once it dries, you’re stuck with it.” Many of today’s business intelligence solutions involve extensive infrastructure projects – building rigid data warehouses and small armies of OLAP hyper-cubes over a period of several months– with actual applications reaching the end-users only at the very end of the project.
While these implementations can provide real business value, their success depends on a clear understanding of the business drivers and requirements at the beginning of the project. Unfortunately, analytical design tends to be an iterative process. For companies where the business changes rapidly or where no clear analysis program has been in place before, the ability to modify analytics applications quickly after they have been deployed will have a significant impact on the project’s success. The same survey mentioned above found that 75% of all analytics applications needed to be modified within 6 months of their initial deployment. Companies should look at their business intelligence system as a living, changing set of applications – and consider the time and cost required for making changes to existing applications as a critical element of their evaluation.
Key Metrics:
Your company can build the most powerful, sophisticated business intelligence system in the world. But if no one in the company uses it because it is too complicated to figure out, the system will be worthless. Ease-of-use takes two forms – for the IT department that maintains and modifies BI applications, and for the end-users who actually use the applications. Both have a significant impact on the long-term success of your business intelligence initiative. Despite this, ease-of-use is often overlooked during the business intelligence selection process. Perhaps because it is an attribute that is difficult to measure (check yes or no – does this product have “ease-of-use” in it?) the standard checklist RFI process rarely even attempts to address this issue.
Companies need to consider what it will take for their employees to use the systems they deploy.
Key Metrics:
By addressing these three factors – speed of implementation, flexibility, and ease of use – during the RFI process, companies can significantly improve the quality of their business analytics and reporting product selections.
The New Rules—With QlikView for SAP®, Affordable BI is Fast, Flexible and Easy-To-Use
With the New Rules for SAP BI, everything that was expensive and time consuming about data analysis is now fast and affordable.
Customer Benefits
The QlikView Connector for SAP® R/3®
The QlikView Connector for SAP® R/3® software provides a seamless connection between SAP and QlikView—allowing direct and immediate data access.
By deploying the QlikView Connector, SAP customers can deploy QlikView applications tied directly back to their FI, CO, SD, MM, and other SAP modules—giving customers a rapid, flexible, and easy to understand way to access, analyze, and distribute their data.
Product Sheet
To read more about the benefits of QlikView for SAP, please download the product sheet. Click here to download
“Last year we wrote off $200,000 in overdue receivables. This year we used QlikView to build a receivables monitoring program to identify problem accounts before they got out of hand. We’ve cut our bad accounts to a fraction of what they were before—this year we expect to write off less than $10,000.”Carlos Gonzalez, VP of IT, Distribution and Systems, Kubic Marketing QlikView for Movex is a suite of powerful, rapidly deployable business analytics applications pre-configured and optimized for your Intentia Movex environment, without requiring the Movex Business Performance Warehouse (BPW). Powered by QlikTech’s patented AQL™ analytics engine, QlikView for Movex provides all categories of users – executive, power and occasional – with interactive and highly intuitive business performance management and analysis capabilities. QlikView can be deployed in a matter of days instead of the weeks or often months required for BPW and traditional BI and OLAP solutions. The result is a powerful BI solution that can be deployed quickly across your organization, delivering a rapid ROI and a low cost of ownership. |
Set up QlikView for JIWA in 30 minutes
JIWA is an advanced and flexible ERP system that most users seem to be very happy with. JIWA comes bundled with Crystal Reports and the end-user has access to relevant information "on-the-fly" and general reporting abilities.
True Business Intelligence for JIWA Financials
If you really want to control your business and utilise the stored historical information that sits in JIWA you need QlikView. We guarantee that you will be impressed with what you can do if you let QlikView extract your JIWA data from the SQL database. We have designed an extremely advanced JIWA analysis application for QlikView that lets you analyse everything from Sales, Purchase, Inventory and Expenses.
You can be up and running QlikView for JIWA in less than one hour!!!!!
Download the complete QlikView for JIWA package
...or contact us today and we will help you get started.