Qlik’s Associative Difference

Qlik's Associative Difference

Putting an end to analytics blind spots. That's the Associative Difference™

The problem with most BI vendors is that they rely on query-based analysis that restricts people to linear exploration within a partial view of their data. Qlik’s Associative engine lets you combine any number of data sources so you can freely explore across all your data and instantly pivot your thinking based on what you see. The result: Powerful insights you miss with other tools.

Our Customers

Our Customers

Here are some of our satisfied customers:

Contact

Contact

Phone: +64 9 419 4300
Fax: +64 9 419 4305
Email: info@visualintelligence.co.nz

Office Hours

Monday - Friday: 8am - 5pm
Weekends closed

Location

Unit 17
33 Apollo Drive
Rosedale
Auckland 0632
New Zealand

How can we help?

    Your Name (required)

    Title (required)

    Company (required)

    Phone (required)

    Email (required)

    Let us know how we can help? (required)


    About Us

    About Visual Intelligence

    Founded in 2002, Visual Intelligence launched QlikView products and services to the New Zealand market, providing organisations with simple ways to measure and analyse business performance throughout the country.

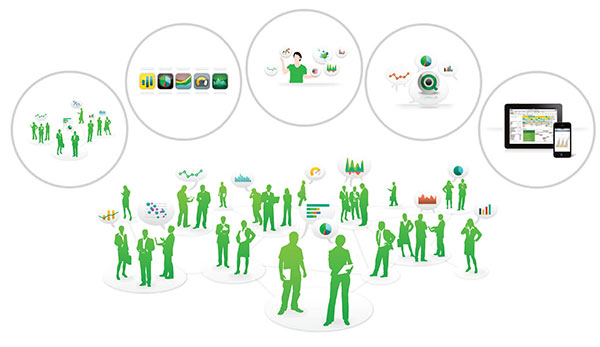
    Over the years, Visual Intelligence’s expertise in the Business Intelligence space has grown to encompass many different business software products across a vast range of industries.

    We know data, and most importantly, we know business. Our experienced team of business consultants can work with you to improve processes and access to key information as well as assisting with how to utilise this information to improve productivity.

    Below is a list of the some of the systems we have worked with (we are adding more all the time):

    AccPac, Bann ERP (Infor), BOB, CBA, Comet, Dynamics, Exonet, EZY, First Software, FreshMax, Great Plains, Greentree, Infusion, InsuranceFaces, Jade, JBA (System 21) by Infor, JBA, JDE, Jiwa, Logistics ERP, MYOB, Navision, NetSuite, Online 2000, Pronto, Sage Pro ERP, SAP, Smartfresh, Sopic, SQL, StreamLine, Syteline, TIMS, TONIQ.

    This means we can tailor a solution that specifically meets your requirements from the Qlik range of products or an alternative custom-build development using other software offerings.
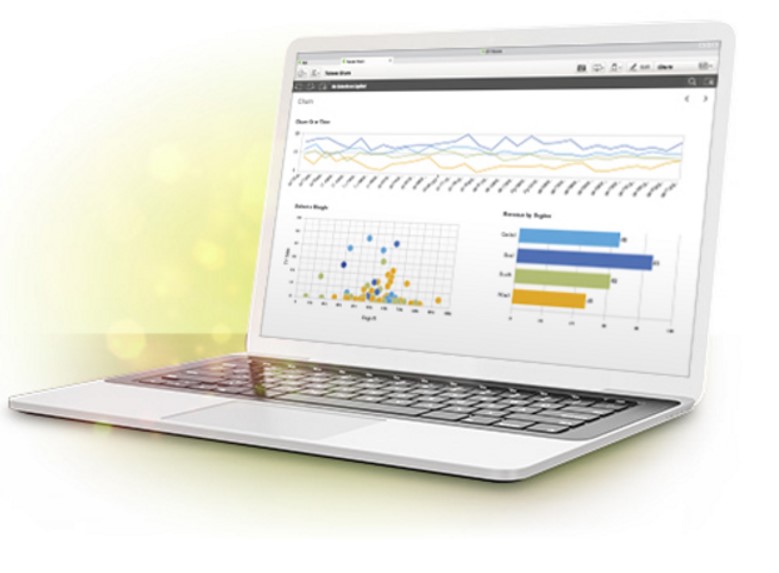
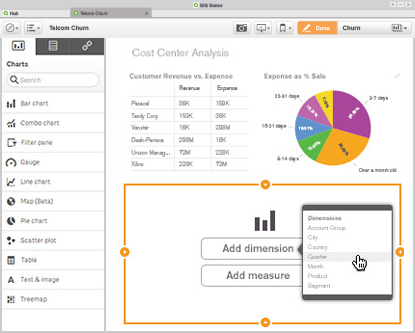
    Our Qlik Experience

    Visual Intelligence is the longest standing and most experienced QlikTech partner in New Zealand.

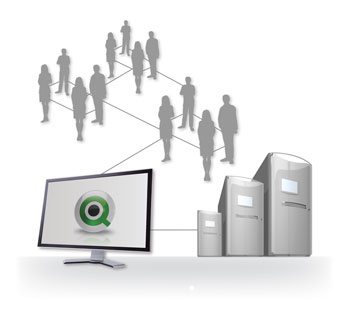
    Our extensive business consultancy experience combined with our advanced understanding of the Qlik product, ensures our customers will receive the best possible service and business intelligence solution. The solutions we provide enable our customers to make business decisions efficiently by analysing the information that matters, and therefore optimising their productivity and profitability.

    Our experienced developers have over 15 years' experience in advanced development of Qlik (including working with many various databases), with over a decade handling implementations here in New Zealand. We believe it is important for businesses to receive support locally, and as we provide all Qlik application development, Qlik training and Qlik support our customers can be confident they will receive the services they require from staff based here in New Zealand in a timely manner.

    Since our focus is 100% Business Intelligence and reporting and we have been working with the QlikView product line since 2002, we can confidently claim to deliver the best Qliksolutions in New Zealand regardless of the data system. No one knows Qlik better in New Zealand.

    Qlik Sense

    Qlik Sense – Unleash Your Intuition

    Imagine analytics so intuitive, anyone in your company could easily create personalized reports and dynamic dashboards to explore vast amounts of data and find meaningful insights. And imagine if this could be done while ensuring accuracy and reliability of data and analytics.

    That’s Qlik Sense— a revolutionary visual analytics platform that supports self-service visualization, guided analytics apps and dashboards, embedded analytics, group collaboration and reporting, all within a governed framework that offers enterprise scalability and trust for IT.

    Qlik Sense lets you rapidly create visualizations, explore data deeply, and share insights instantly, to reveal connections in your data and see opportunities from every angle.

    Interactive data discovery and visualization let your instinct lead the way

    Qlik Sense makes visual dashboard creation simple and intuitive, but doesn’t stop there. Qlik Sense also makes it easy to explore the data so you can understand what’s happening and why. Ask questions. Follow your intuition. Seamlessly navigate vast amounts of data from multiple sources. Then share your insights visually and accurately with other users.

    adfasdf

    Smart visualizations reveal hidden insights

    Smart Visualizations use innovative new techniques to convey the meaning in your data. In combination with the patented Qlik data indexing engine, they are fully interactive and responsive. You can easily explore in any direction to discover insights that would have been hidden in query-based or hierarchical tools.

    Smart Search gives you ultimate flexibility

    Not sure where to begin looking? No problem. Simply type search strings so Smart Search can connect the dots, uncovering matching information and revealing data relationships across your entire data set.

    Explore multiple data sources in a single app

    Qlik Sense connects to multiple data sources to provide more comprehensive views, without compromising performance. Qlik Sense automatically profiles and connects data sources so you don’t have to be an expert.

    Access analytics anywhere, anytime, on any device

    Solve problems on the go. Move seamlessly from desktop to tablet to smartphone, while Qlik Sense automatically adapts to the device. Wherever work may take you, Qlik Sense helps you respond in real time and keep ideas in motion.

    Rich data storytelling help you collaborate and share insights

    Our data storytelling functionality makes it easier to share analysis visually, communicate your findings with teams, and collaborate more efficiently. Move directly between stories and live analysis, in context, to immediately answer questions and reduce delays in decision making.

    Governed data enables self-service simplicity

    Any user can create their own data visualizations, dashboards, and reports while giving IT confidence that they’re drawing upon consistent, secure libraries of governed data and measures.

    Anyone can drag-and-drop to create personalized data visualizations, reports and dashboards

    With Qlik Sense, users at any level can bring their insights to life—no expert skills required.

    • Drag-and-drop techniques allow anyone to create compelling visualizations
    • Built-in libraries let you reuse of data, metrics and objects
    • Progressive creation lets you keep it as simple—or sophisticated—as you like

    Governed, enterprise-class technology provides centralized control with no trade-offs

    Finding a balance between the needs of business and IT has always been a challenge. But Qlik Sense is visual analytics software that was designed to serve them equally: business users get total flexibility and agility while your IT team maintains centralized control and governance.

    Governed, Self-Service Creation

    Business users need to be able to explore data and answer questions on demand without waiting on IT to build or update analytics. But data needs to be secure, consistent and trusted—and Qlik Sense provides robust governance to make this all possible.

    • Shared Object Library: Pre-defined dimensions, measures and visualizations ensure consistency of data and analytics.
    • Progressive Creation: Allows you to grant users additional access to create their own visualizations, measures and data models as their skill level increases.
    • Managed Data Connections: Ensure all applications use commonly defined data sources, with access controlled by security rules.

    Best-of-Breed Development

    Qlik Sense offers self-service creation for everyone, and gives developers a fast and powerful way to build custom applications, embedded analytics and extensions using standard skill sets and tools.

    • Rapid Self-Service Creation: Easy-to-use self-service interface enables everyone to create visualizations using drag-and-drop techniques.
    • Powerful Open and Standard APIs: Allows developers to build custom guided analytics apps, embed analytics in web pages and workflow applications, and create new types of visualizations and analytics to meet custom business requirements.
    • Robust data integration, including big data: Profile and bring together data from multiple sources and systems—including internal, external, and big data sources—to a complete view and access to deeper insights.

    A Platform For The Entire Enterprise

    Qlik Sense was designed with the enterprise in mind, providing sophisticated, centralized control and scalability.

    • Manageability: Features flexible license allocation, usage monitoring, and an easy-to-use interface that saves time and simplifies troubleshooting.
    • Security: Implement enterprise-level security requirements with a flexible security-rules engine, granular control for progressive development, plus powerful audit and logging.
    • Scalability: Support for virtualization, elastic scaling and geographically disperse clustering enables global deployments.

    QlikView

    What is QlikView?

    QlikView is the most flexible Business Intelligence platform for turning data into knowledge. More than 24,000 organisations worldwide have enabled their users to easily consolidate, search, and visually analyse all their data for unprecedented business insight using QlikView’s simplicity.

    Effective decision-making is based on having the right information available and easy accessible. Taking just minutes to learn, the automatic associations of QlikView create endless possibilities for making ad hoc queries without requiring tediously defined structures and hierarchies, as is typical in other data analysis tools. QlikView promotes unrestricted analysis of application data, helping users make time-saving and accurate decisions.

    It brings a whole new level of analysis, insight, and value to existing data stores with user interfaces that are clean, simple, and straightforward.

    The Associative Experience

    QlikView enables users to gain unexpected business insights by understanding how data is associated—and what data is not related. They can conduct direct and indirect searches across all data anywhere in the application—globally or within a single field. When the user clicks on a data point in a field, no queries are fired. Instead, all the other fields instantaneously filter themselves based on the selection the user made.

    Powered by In-Memory Technology

    The engine behind associative search is QlikView’s next-generation in-memory architecture. It virtually eliminates the problems and complexity plaguing traditional, slow, disk-based and query-based BI tools that deliver little more than static, prepackaged data. With QlikView, all your data is loaded in memory and available for instant associative search and real-time analysis with a few clicks.

    Fast to Deploy, IT Efficient

    QlikView breaks out of the gridlock of the traditional BI world, where business users and developers spend months documenting and coding these requirements into dashboards, analysis, and reports, using different products for each output. Pulling data into QlikView takes minutes because data is not required to be staged or stored in intermediary formats such as data warehouses or cubes (although QlikView can source data from these systems).

    QlikView integrates both the building of the back-end underlying analytic calculations with the front-end user interface. With this complete BI solution, developers have one place to build, instead of having to use separate BI tools for dashboards, analysis and reports. Finally, the resulting QlikView application provides powerful associative search and data visualization capabilities that allow business users to view their own slice of the underlying data.

    Visual Intelligence can build QlikView data models in as little as 1-15 working days (depending on availability of the data and complexity of the analytical application) to deploy to users and can train you to do the same.  Often one QlikView application can often replace hundreds of reports and the cubes used for them, reducing the need to IT support and time delays.

    Qlik GeoAnalytics

    Qlik GeoAnalytics

    Geospatial visualization and analytics

    GeoAnalytics not only provides comprehensive mapping capabilities but also moves beyond visualizations with built-in spatial analysis support for a broad range of advanced geoanalytic use cases to help reveal crucial geospatial information and expose hiddgen geographic relationships.

    Powerful map visualizations & location-based analytics for both Qlik Sense and QlikView

    High performance, Interactive mapping

    Easily create maps using automatic geo-data lookup and then overlay them with different visualizations

    Be more productive with on-the-fly location lookup capabilities

    Improve understanding by exploring all geo information along with any relationships within one map visualization

    Gain geospatial insights with visualizations

    Go beyond map visualizations to understand and analyze geospatial relationships

    Efficiently access, visualize and analyze any existing geospatial related data and applications

    Gain insight into patterns not easily interpreted through tables or charts

    Broad location-related use cases

    Deliver mapping and location-based analytics to every user throughout the organization

    Share a common set of tools with a full spectrum of mapping and geospatial capabilities

    Provide credibility and domain expertise to a customer's geospatial engagement

    Learn more about Qlik GeoAnalytics

    What is spatial analysis?

    GeoAnalytics Data Sheet

    Explore this in-depth guide to spatial analytics strategies

    Learn more about Qlik GeoAnalytics advanced mapping and location-based analytic capabilities

    Qlik GeoAnalytics Product Tour

    HR

    Human Resources (HR)

    Utilize employees strategically. Drive profitability with business partnerships. View labour, benefit and recruitment data holistically across the organisation.

    Work it out with Qlik


    Workplace management

    Optimise employee management and succession planning. Analyse staffing resources and on boarding. Assess training and education offerings. Monitor productivity trends and improve workplace relations.


    Total rewards

    Control staffing efficiency, benefit offerings and labour costs. Analyse compensation vs. performance. Enable benefit and payroll forecasting. Get a holistic view of total rewards from disparate sources.


    Enhance recruitment

    Streamline recruitment and documentation. Decrease turnover. Enhance employee leads and find better quality candidates. Increase internal engagement and productivity. Improve organizational forecasting.


    Supply Chain

    Supply Chain Management

    Explore supply chain data in unprecedented ways.

    Analyse, visualize, and explore relationships between complex data sources, driving better business results and a competitive edge.

    Improve planning. Increase performance. Reduce risk.

    Connect and manage your supply chain from end to end while increasing visibility, reducing risks, and optimizing operations.


    Take control of your supply chain

    Qlik lets you explore all of the data and processes impacting your supply chain in ways you never could have imagined.


    Data Discovery - See Your Supply Chain from Every Perspective

    Qlik helps simplify supply chain analytics, helping make new associations between once disparate systems to reveal hidden relationships.


    Top Solutions in Supply Chain

    Supply chains are complex. From forecasting and planning, to production, warehousing, and transportation, all aspects must be finely tuned.